

Physicochemical Parameters
Within the months that the Proteus units have been installed, for the sake of brevity a 24-hour period has been selected to illustrate some of the data. Each parameter monitored is part of a puzzle that contributes to our understanding of the overall physicochemical status of the river and provides a starting point for understanding what state the ecological systems and aquatic life might be in as a result.
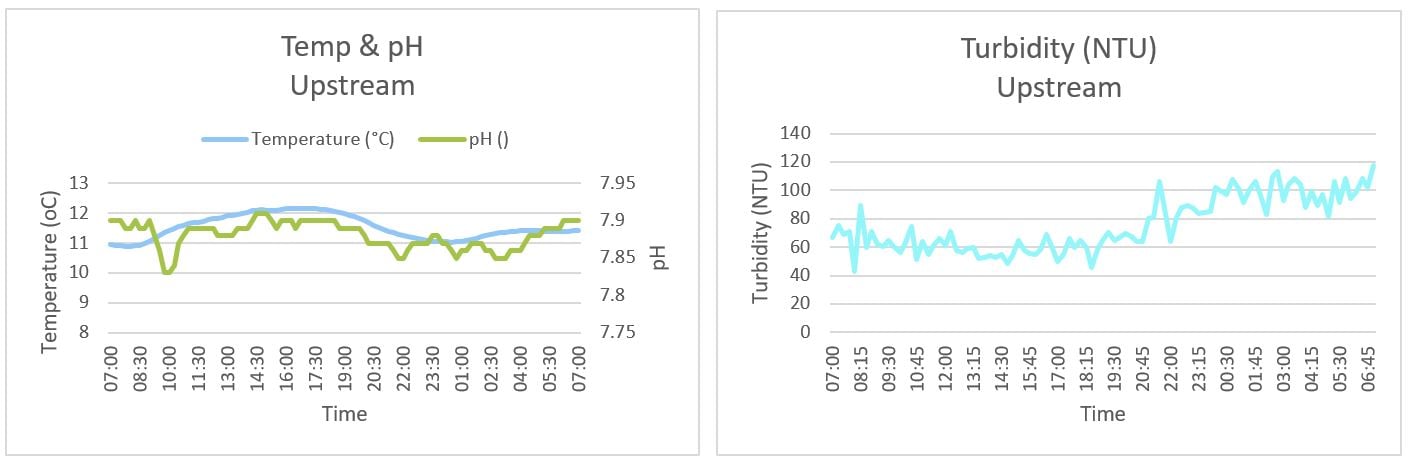
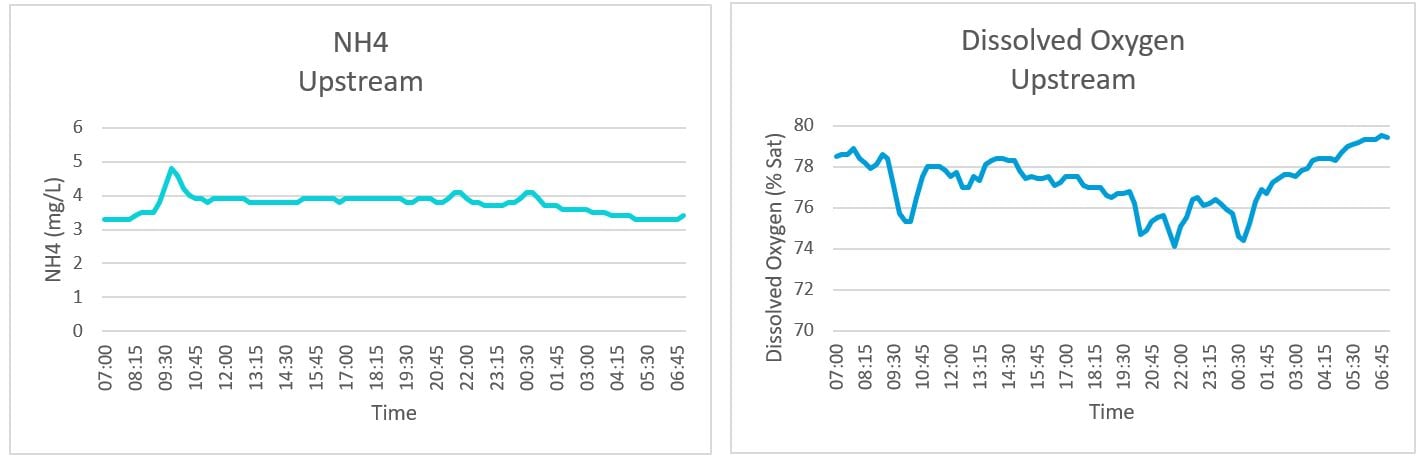
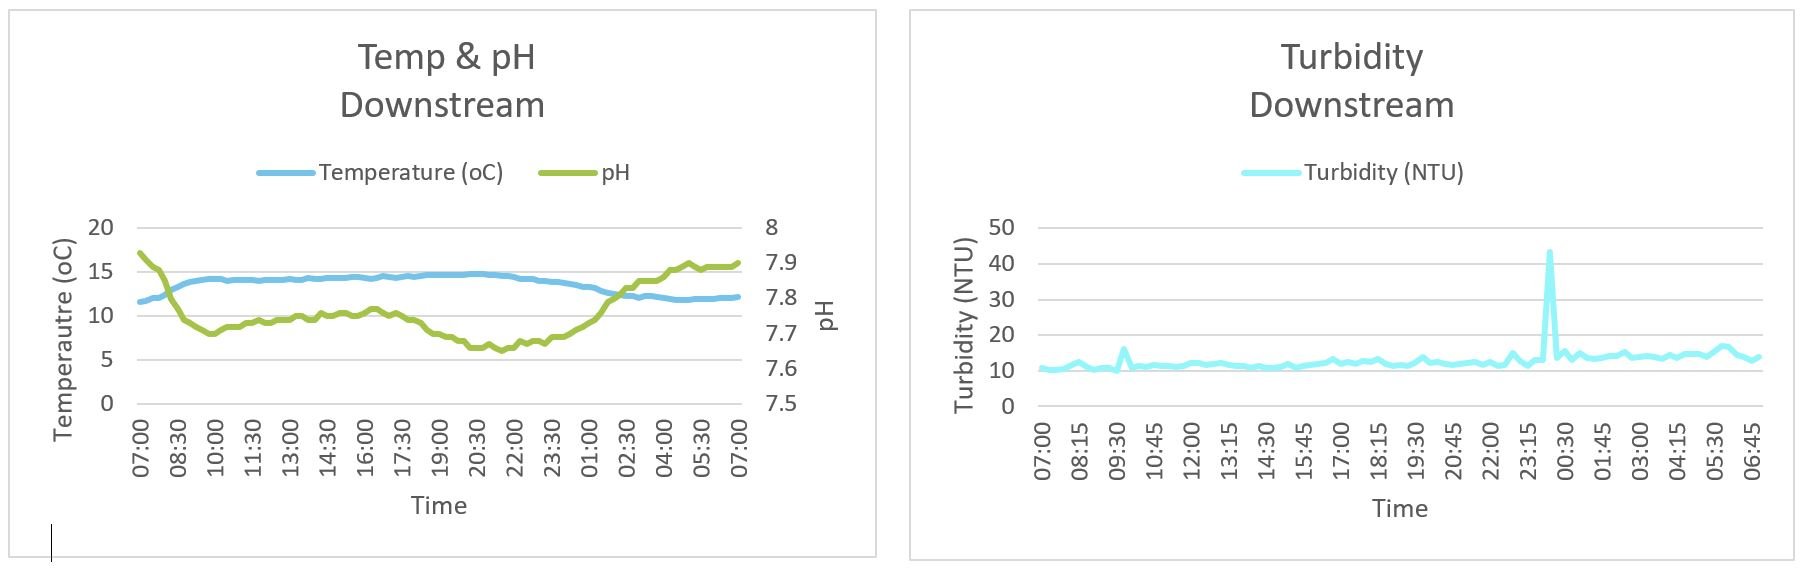
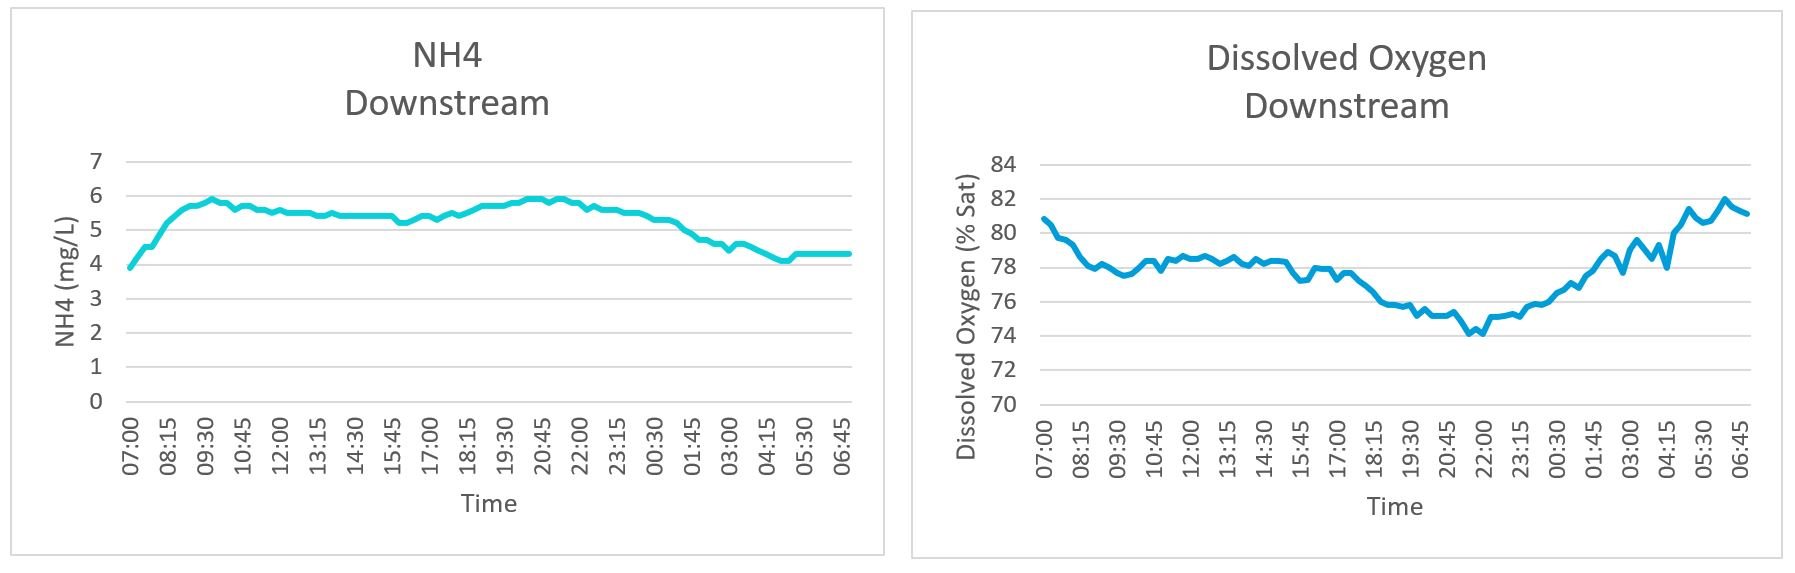
From 24 hours of monitoring its evident that the upstream and downstream sites have some distinct differences in characteristics. The cyclical impact of the WWTW treated effluent outflow on the downstream site is somewhat visible in the Ammonium and DO panels. The frequent fluctuation in the upstream DO panel, alongside variable turbidity, suggests there is at least one additional impacting factor contributing a polluting element to the upstream site; potentially livestock with access to the river or similar, although Ammonium remains slightly lower than at the downstream site where effluent undoubtedly elevates the levels.
Upstream Physicochemical
Downstream Physicochemical
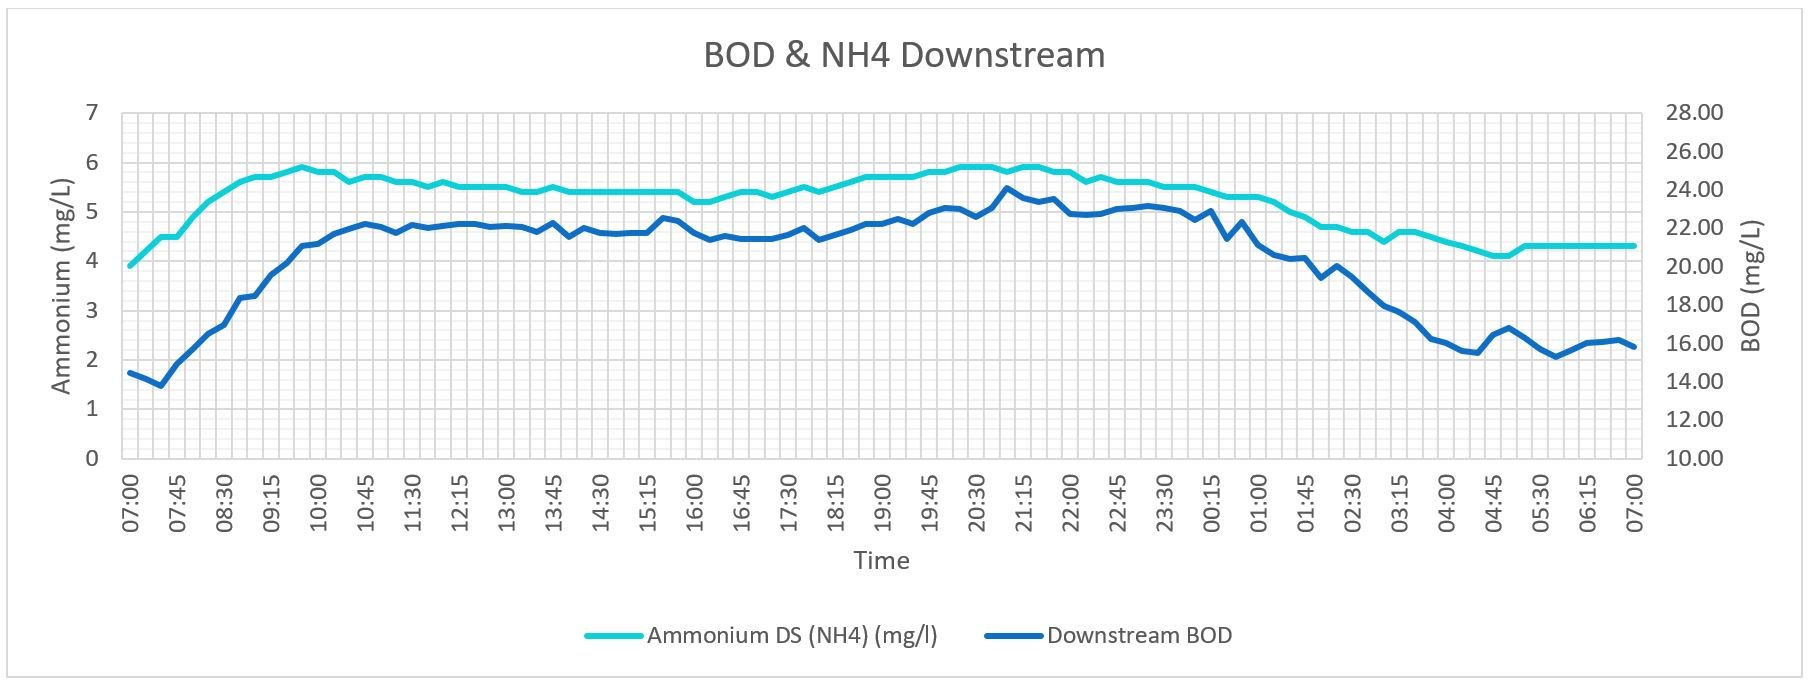
 Whilst this data is a good starting point, the puzzle is incomplete. The power of real-time BOD monitoring cannot be overstated. The graph below demonstrates that downstream of the WWTW, ammonium and BOD follow each other closely; both picking up the wastewater signal as effluent increases and decreases throughout its daily cycle; effluent release tends to increase after periods in the morning and evening coinciding with increased toilet, shower and other domestic water usage.
In terms of range BOD fluctuates over a wider range owing to its very nature, which can make it easier to identify spikes. While neither parameter should be measured in isolation, in terms of understanding the impact on water source, ammonia also relies upon the simultaneous measurements of pH and temperature to determine the level of toxicity to aquatic life. BOD is more contextual at the point of measurement as it is a measure of a process, not just a substance.
ISE’s measure Ammonia (NH3) ion, Ammonium (NH4), in water; NH4 it can be combined with pH to calculate the ratio of Ammonia/Ammonium and systems like Proteus can provide both outputs in real-time. Ammonia is perhaps the most useful parameter from the more traditional water quality suite however, in terms of method it tends to be high maintenance method of monitoring and can incur costs along the way. For example, ion-selective electrodes are often selected due to their relative inexpensive cost at point of purchase however the membrane-based sensors have a limited operational life time before the membrane expires and as a technique the membrane remains vulnerable to interference from other ions and potential drift. While Ammonia forms an important part of the picture, it is questionable as to whether with the new monitoring requirements, Ammonia is suited to being the main parameter by which pollution signals are tracked in water. By comparison, using fluorescence to monitor BOD is a more flexible parameter prone to less interference and using optics that have a long lifetime and lower consumables cost.
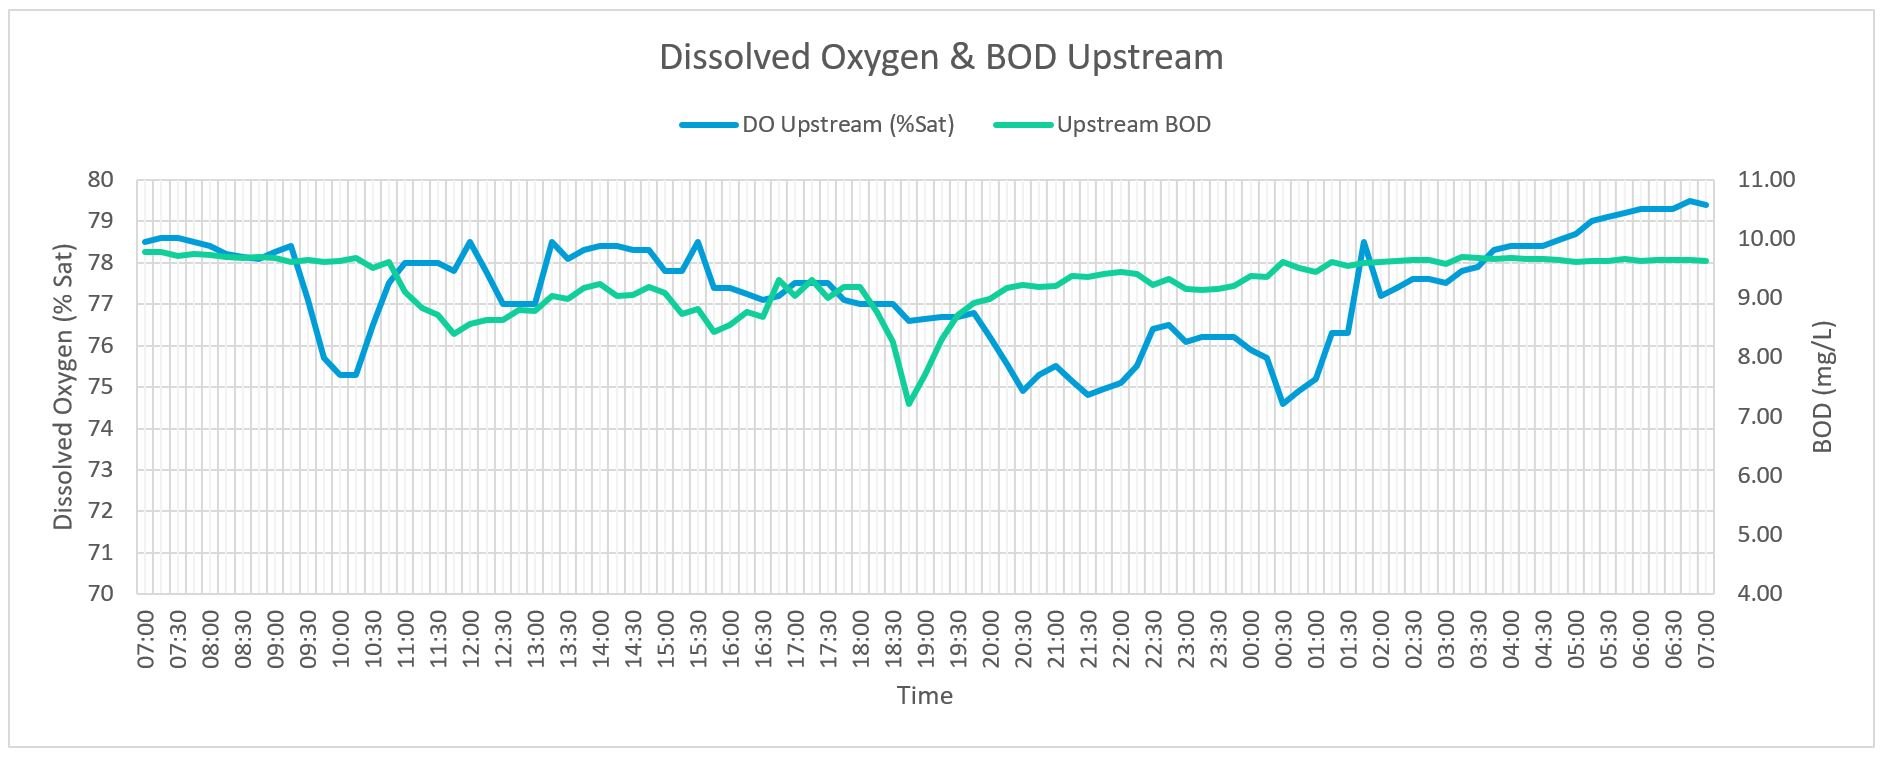
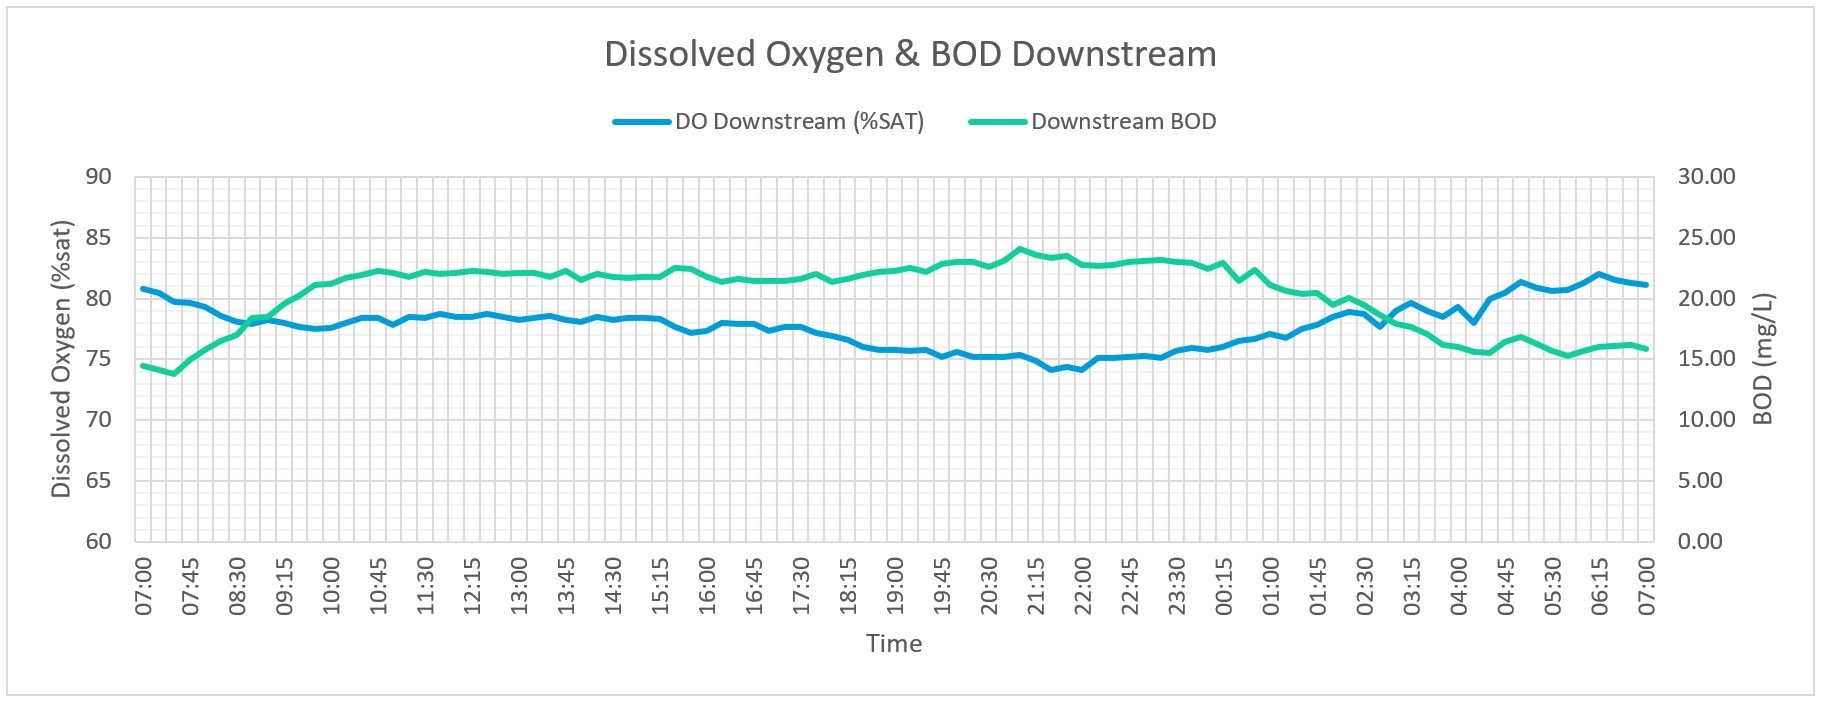
Comparing DO and BOD at both upstream and downstream monitoring sites further supports the justification for using BOD in real-time monitoring. In particular the upstream site where both parameters show significant fluctuation but without the addition of BOD, it doesn’t show the impact of the changing oxygen level on biological activity in the water. Remove DO from the picture and the BOD is still providing useful information but remove BOD and a lot of the meaningful detail is lost. At the downstream site, the two parameters track each other reasonably well however BOD remains to have an edge in terms of capturing the finer detail of the system.

Coliforms
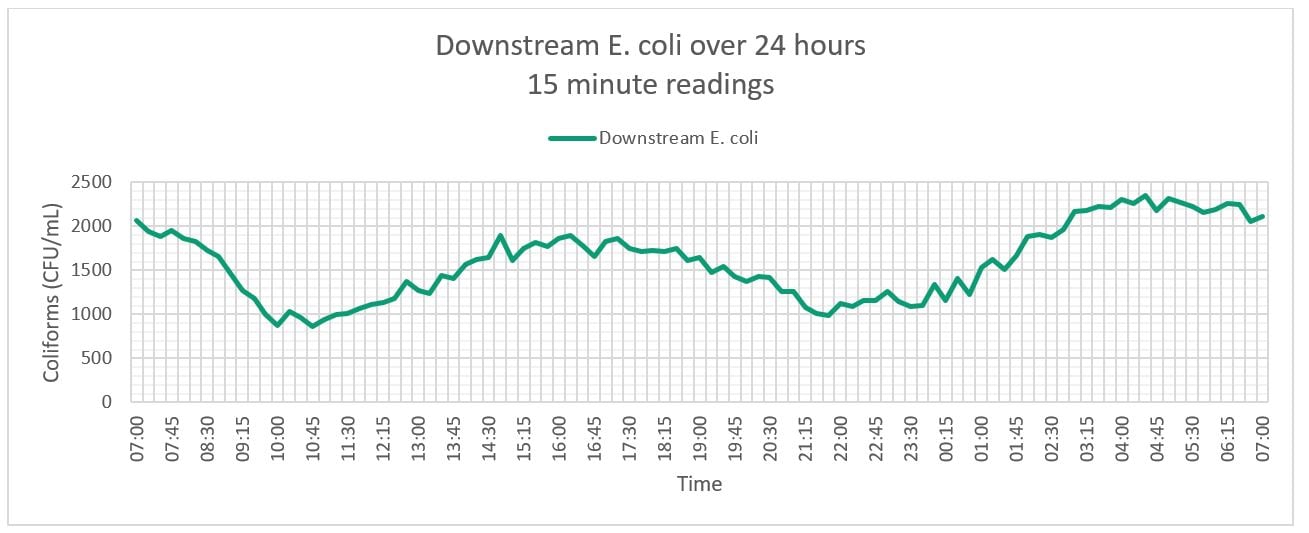
Coliform monitoring is far rarer downstream of SWOs, as in the UK as most do not have a permit for coliform removal, although these are seen when discharging into environmentally sensitive waters. Although some coliform removal is expected as part of the treatment process, which includes using bacteria for the methane fermentation of sludge, facilitating the breakdown of the polluting organic matter load. As such, we expect to see some coliform peaks downstream of WWTW as they are not specifically treated but for treated wastewater, coliforms will reduce as part of the treatment process.
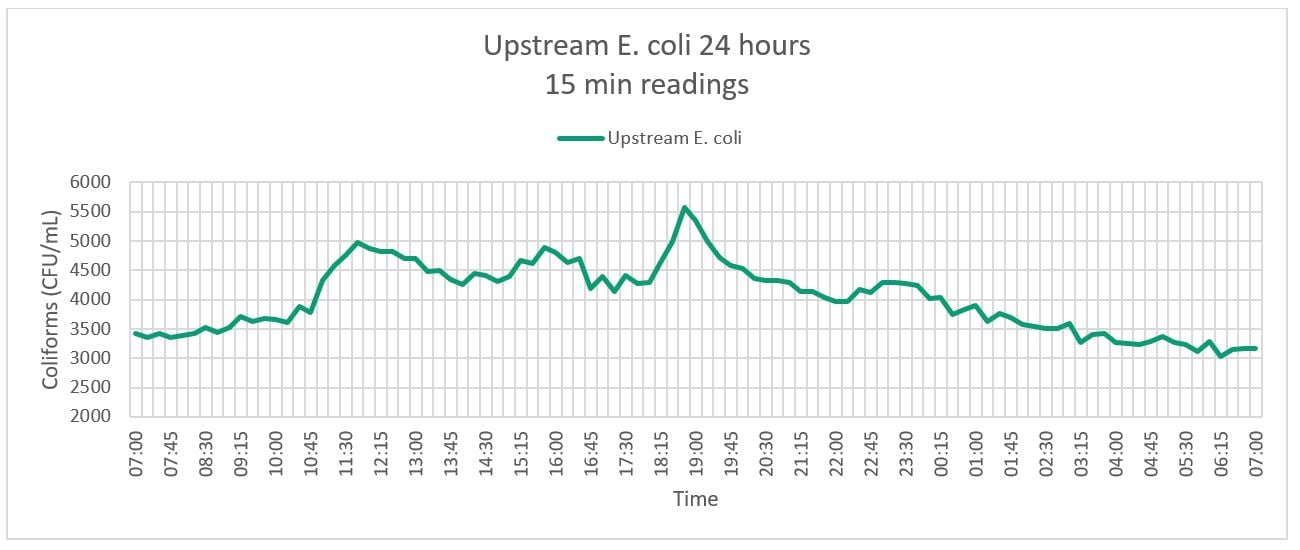
The current catchment monitoring site is interesting as the upstream site has a larger quantity of coliforms than the downstream site, although over 24 hours the cyclical pattern observed in other parameters is still present. While the current reasoning for the relatively high level of coliforms upstream is unknown, the high levels are indicative of at least one additional pollution source. The downstream numbers are reduced in comparison, indicating that the upstream influence is localised and the addition of effluent at certain volumes may be actually causing a degree of dilution to the coliforms travelling downstream.
The selection of water quality parameters for monitoring should be an iterative process, and indeed technology has allowed this since monitoring began. The number of monitoring points has significantly increased over the last few points and will continue to under the 2021 EA legislation but there needs to be a push to maximise these monitoring opportunities to ensure the most complete picture of water quality is attained. The focus in mainstream media has been water companies and sewage spills but the fact of the matter is, sewage spills and effluent are only a small part of the overall issue. If governing bodies are seriously committed to improving water quality in the UK, there needs to be a shift in approach and a willingness to embrace new technologies to augment the existing protocol. Knowledge is power or so the old adage goes but for understanding and improving water quality, it couldn’t be truer.
