Context
By harnessing natural wetland processes innovative approaches have greatly increased the contaminant removal efficiencies of ICWs for sustainably treating wastewater1. ICWs applied to many different applications, from reducing the concentration BOD and nutrients in sewage and agricultural runoff to cleaning fuel contamination from road drainage systems2.
ICWs are dynamic assets requiring careful design, operation and maintenance. With establishment times of years, complex ecological dynamics and loading patterns effective monitoring is essential to ensure ICWs achieve pollutant reduction targets consistently.
Application
The Proteus multiparameter sonde detects the natural fluorescence signals of tryptophan which is associated with organic pollution, and CDOM which is representative of degraded terrestrial organic matter3, 4, 5. Together this information is aiding the design of ICWs for managing agricultural run-off into catchments where it can negatively impact river health and pose a risk to human health6.
In combination with a solar powered telemetry system and flow meter the Proteus enables a remote data feed, providing an efficient ICW WQ monitoring solution readily deployed on site. https://proteus-instruments.com/proteus-telemetry-systems/
In the design phase, Proteus was deployed at a field-stream boundary location identified with hydrological modelling data and site surveys (image 2). Proteus readings were coupled with an autosampler to obtain paired laboratory samples for BOD, Coliforms, TOC, turbidity, ammonia and nitrate. This data was then used to characterise the water composition and generate a site-specific calibration based upon a dynamic range of conditions.
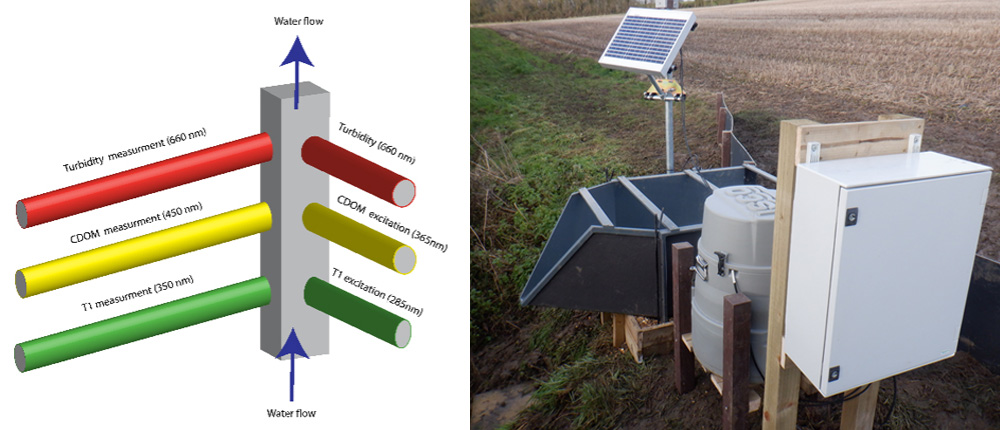
Image 2. Schematic of Proteus fluorescence principle and example of deployment with autosampler and telemetry in agricultural run-off monitoring.
Once calibrated the instrument provided derived parameter outputs for BOD mg/L, Coliform CFU/100mL and TOC mg/L with strong correlations to lab values. The autosampler was then removed, providing cost savings on equipment hire, site visits and lab testing time during baseline data acquisition.
Result
Continuous monitoring trends revealed a consistent relationship between elevated TOC and nitrate concentrations with increased flow, represting soil erosion and nutrient loss detrimental to river health. The derived BOD and Coliforms parameters also followed the hydraulic loading pattern but spikes coinciding with farming activity, principally applications different organic matter, slurry and leachate entering surface and subsurface flowpaths could be identified. The data was then utilised in design to refine pollutant load capacity and treatment requirements of the system for future expansion of intensive agriculture in the catchment7.
Benefits of including real-time WQ data in ICW projects
Many ICWs have a defined inlet and outlet facilitating direct monitoring of flow and evaporative losses. The sampling and analysis of water quality samples required for calculation of organic pollutant load rexctions is time consuming and costly when conducted manually. Continuous ICW pollutant removal data can transform an ICW into an on-line asset which can contribute to:
- Operating Techniques Agreements for regulated activities.
- Protecting ICWs from overloading treatment capacity.
- Track the impact of operational interventions – for example vegetation management, microbial feedstock additives, electrochemical treatment.
- Sustainability reporting against targets e.g Net Zero by 2030.
- Supporting natural capital schemes as part of Carbon and Nutrient credits.
- Industrial waste water reuse following treatment in ICWs.
Need a solution to monitor water quality in your ICW project?
Contact Proteus Instruments for a discussion on how our real-time monitoring solutions can help you achieve new insights to optimise the design, operation and maintenance of your ICW project.
Key steps for monitoring:
- Identify parameters of concern.
- Develop a monitoring program that includes baseline monitoring before the project is implemented
- Implement program of works with monitoring of impact on any receiving water bodies during works
- Continuously collect, review and synthesize data in real-time during settling and establishment phases.
- Calculate load reduction.
- Adjust monitoring for long term operation of the ICW asset.
References and further information
1Application of native plants in constructed floating wetlands as a passive remediation approach for PFAS-impacted surface water, Journal of Hazardous Materials, 2022 https://doi.org/10.1016/j.jhazmat.2022.128326.
2Constructed treatment wetland: Glance of development and future perspectives, Water Cycle, 2020, https://doi.org/10.1016/j.watcyc.2020.07.002
3Fluorescence spectroscopy as a tool for determining microbial quality in potable water applications, Environmental Technology, 2012. DOI: 10.1080/09593330.2011.588401
4Fluorescent components of organic matter in wastewater: efficacy and selectivity of the water treatment. Water Research, 2014. https://doi.org/10.1016/j.watres.2014.02.040.
5Comparison of UV–VIS and FDOM sensors for in situ monitoring of stream DOC concentrations. Biogeosciences, 2015, DOI: 10.5194/bg-12-3109-2015
6A Review on Constructed Treatment Wetlands for Removal of Pollutants in the Agricultural Runoff. Sustainability 2021. https://doi.org/10.3390/su132413578
7https://assets.publishing.service.gov.uk/government/uploads/system/uploads/attachment_data/file/964634/WITHDRAWN-Guidance-Manual-for-Constructed-Wetlands.pdf